Software Quick Guide#
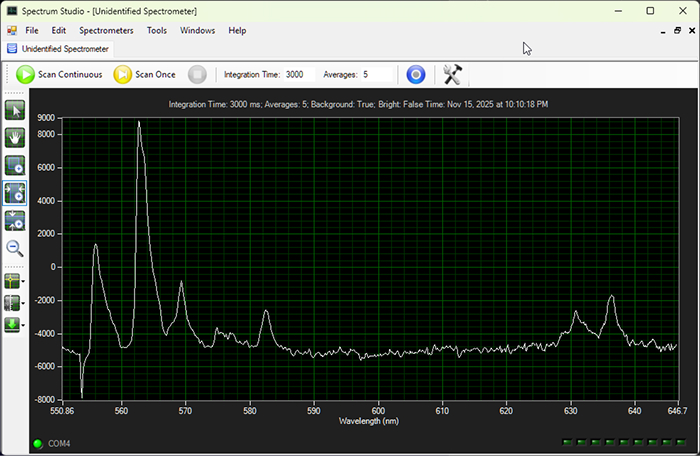
SpectrumStudio is the original control and acquisition software for the BTC110 / B&W Tek OEM spectrometer used in DIYraman.
Click to Download - SpectrumStudio
It is used to:
- Set integration time and averaging
- Apply background subtraction
- Use a wavelength calibration
- Save spectra as CSV for analysis and open-hardware documentation
Adapted from software handbook
The following reference is summarized and adapted from the handbook built in to the software. More information can be found in SpectrumStudio under Help → Contents or by pressing CTRL+F1.
Minimal workflow#
-
Detect the spectrometer
Click → creates a tab for each device.
 -
Set exposure & noise level
- Integration time: type value in the Integration Time box (e.g.
50 ms,250 ms,2500 ms). -
Averages: set a small number (e.g.
3–15) in Averages. -
Start measuring
- Live view:
 (Scan Continuously)
 -
Single snapshot:
 (Scan Once)
 -
Set a dark background (recommended)
- Block light (objective capped / finger on input).
-
Take a scan, then click
 (Use current scan as background).
→ All future spectra are background-subtracted. -
Scan again
- Take another scan.
→ Now the output spectrum is background-subtracted. -
When adjusting the integration time, record a new background to subtract.
-
Save spectrum data
- Click
 or File → Save As…
 -
Store the CSV together with: sample ID, integration time, averages, background on/off, calibration version.
-
(Optional, as-needed) Adjust wavelength calibration
- Record a lamp (CFL/neon).
- Click
 and tweak coefficients so known lines match their wavelengths.
Essential features at a glance#
Text fields:
- Integration Time – exposure in ms (typ. 50–65000 ms).
- Averages – number of scans the PC averages before showing one spectrum.
| Icon | Control | What it does (in one sentence) |
|---|---|---|
| Detect Spectrometers | Scans all COM ports and opens one tab per detected spectrometer. | |
| Scan Continuously | Repeats scans with current settings for a live spectrum view. | |
| Scan Once | Acquires exactly one spectrum - or number of Averages - defined. | |
| Stop | Finishes the current scan and then stops continuous acquisition. | |
| Set Background / Clear Background |
Stores current spectrum as dark/background and subtracts it from future scans. / Disables background subtraction (background = zero). |
|
| Log Data (On/Off) | When enabled, every finished spectrum is written to disk (see Options → Data Logging). | |
| Wavelength Calibration | View or edit pixel→wavelength polynomial coefficients. |
Graph interaction & cursors#
| Icon | Action | Use it for |
|---|---|---|
| Pointer / Default | Move cursors and interact normally with the graph. | |
| Pan | Drag the view around (hold Ctrl over the graph for temporary pan). | |
| Zoom X+Y | Draw a rectangle to zoom into a region (hold Shift for temporary zoom). | |
| Zoom X | Zoom only along wavelength/pixel. | |
| Zoom Y | Zoom only along intensity. | |
| Zoom Out | Step back out of previous zoom levels (right-click on the graph). | |
| Cursors / Line ID | Show a vertical cursor for precise wavelength/line lookup and a horizontal cursor for intensity comparison. | |
| Linear / Log scale | Switch Y-axis between linear and logarithmic intensity. |